CISA KEV performance in the Financial Sector
Tags:


As a security data nerd I am absolutely spoiled here at Bitsight. So much so that I have to stop myself from doing little projects and requests so I can dive into the “big” stuff1. So it is always refreshing when folks see a piece of research and decide “hey can you give me more information on my little corner of the world.” Then of course and can throw off those notions of “stopping” and just dive back in.
Such was the case with our recent Known Exploited Vulnerability (KEV) research. In the report, we looked at the exposure and remediation performance of various industry sectors on vulnerabilities present in the Cybersecurity Infrastructure Security Agency (CISA)’s KEV Catalog. Broad sector categories are useful because they provide good sample sizes, and help to distinguish relative performance differences across the broader cybersecurity landscape. The problem is there is still variation at that Sector level. For example “Finance” includes small, regional banks as well as absolute giants of investment banking. Doing the breakdowns for various sub sectors is do-able (we have the data), but there are always issues of sample size once we get things broken down.
The above examples focused on the Financial Sector are not random. I’ve had a number of requests to examine the finance sector in more detail including breakdowns of exactly what kind of financial organizations are experiencing greater risk and who is remediating more quickly. So, I put together a few pretty graphics.
Prevalence
Just like in the aforementioned report we’ll start with an examination of the percentage of organizations for whom we detected a KEV on their infrastructure in 2023. This time, in Figure 1, we break it down by subsectors in the Finance industry. Helpfully we include some baseline measures and geographic slices.
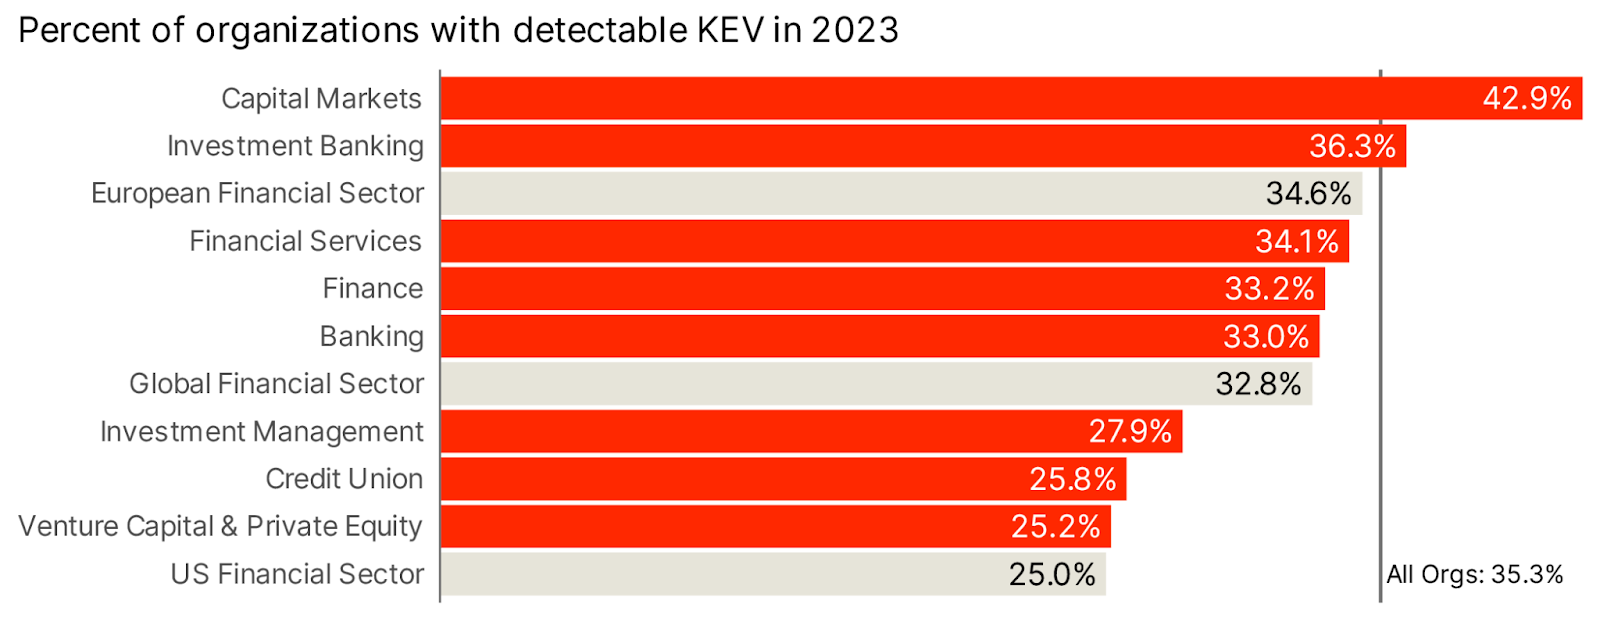
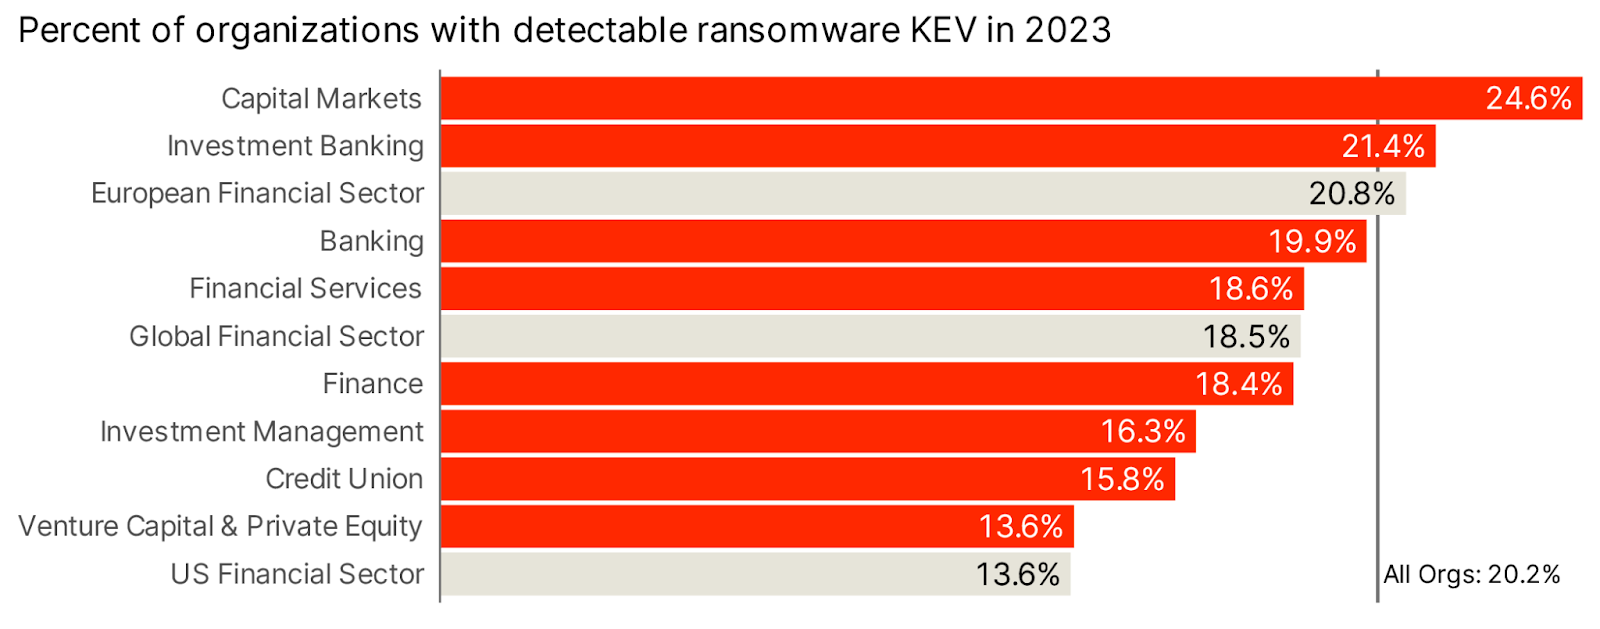
Find your favorite money handler above, but it’s clear that generally financial orgs do better than the global average of 35.3%, with the exception of Capital Markets and Investment banking. Capital Markets includes firms that create trading platforms and technologies (such as S&P ratings), which may require technological diversity and internet presence, leading to the higher likelihood of KEVs. On the other end of the scale Credit Unions usually only need a consumer facing website, something that is darn near a commodity at this point. A similar pattern emerges if we ask about ransomware KEVs.
Of course, it is known that these values are probably most influenced by the size of the organization. We do some geographic breakdowns of the financial sector with comparisons to the global distribution of sectors by the size of the organization in Figure 3.
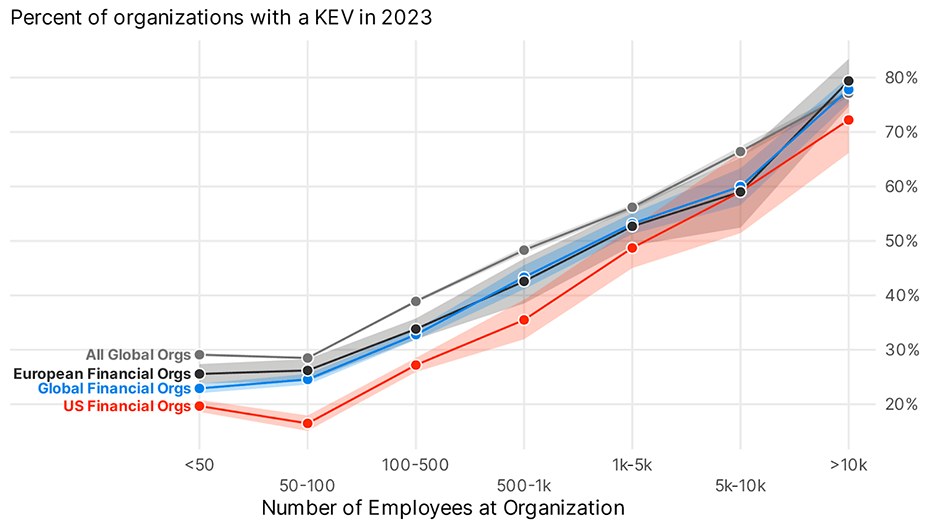
Of note here is that the general pattern seems to hold for all geographic slices regardless. Large companies are more likely to have large infrastructure, with more technologies. That greater exposure surface and diversity is likely to lend itself to a higher likelihood of exposure. In an effort to metaphorically walk and chew gum, let’s see if we can break things down by subsector and organizational size in Figure 4.
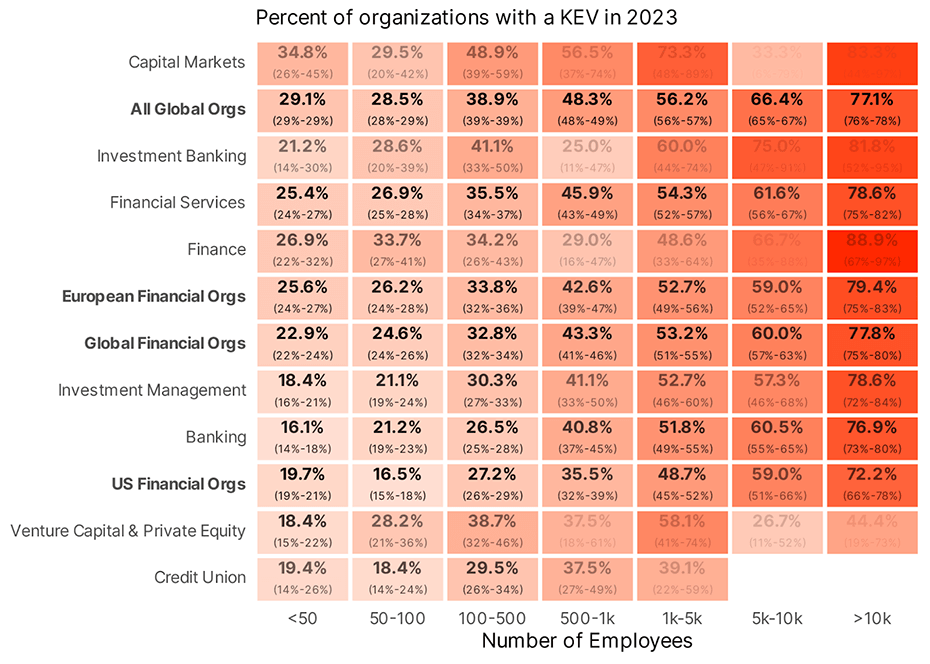
Here is where we start running into some issues with sample size. As noted in the caption we fade the text out to oblivion when we don’t have enough data to be confident about the result. In general, the same effect is present across subsectors, as the organizational size increases the likelihood of detecting a KEV increases. So if you work at a financial institution, you should be able to identify where you land with KEV prevalence.
Overall prevalence of KEVs is interesting, but for those security folks down in the digital trenches of financial organizations might be curious about what specific CVEs they are perhaps a bit more likely to see exposed to the wide world. In FIgure 5 we explore any that we can find that might be a bit more common than others.
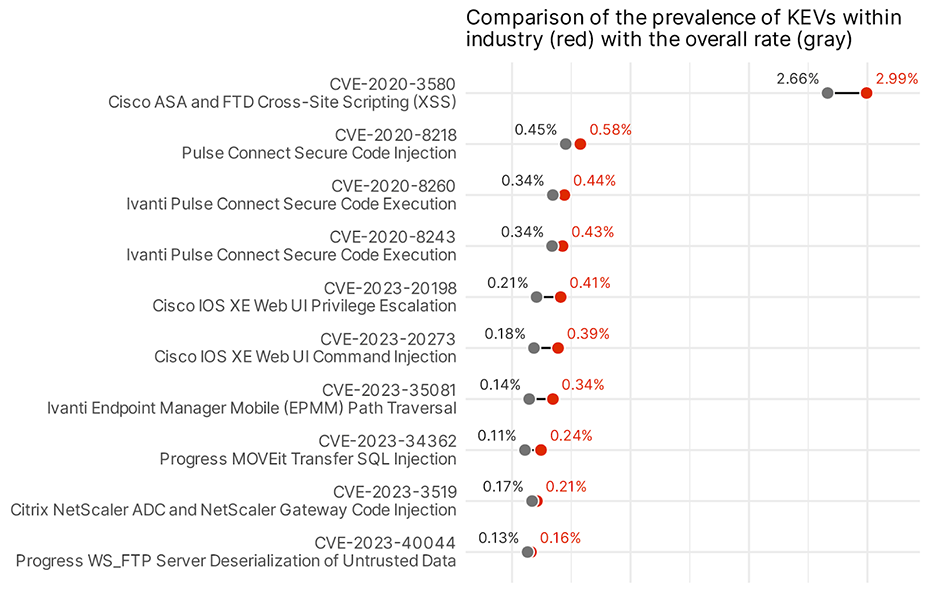
While some of the absolute values aren’t exactly eye-openingly large, some of the ratios might stop and make you say “huh”. For example, it seems that the finance sector is a little more than 25% more likely to have Ivanti vulnerabilities than the global average. Interesting given the slew of vulnerabilities this year. In general, while some of the top vulnerabilities in the main report tended to be things like Apache servers, we see a lot of gateways in Finance. That may indicate that Finance is good at (or at least not worse) then the industry in general at keeping their web presence squeaky clean, but not so great at making sure the external gateways are up to date.
Remediation
Exposure is one thing, especially when it comes to those gateways, but how quickly organizations react to those vulnerabilities is critical in reducing risk. So let’s take a look at how well finance (and various subsets of finance) does compared to the rest of the global average in Figure 6.
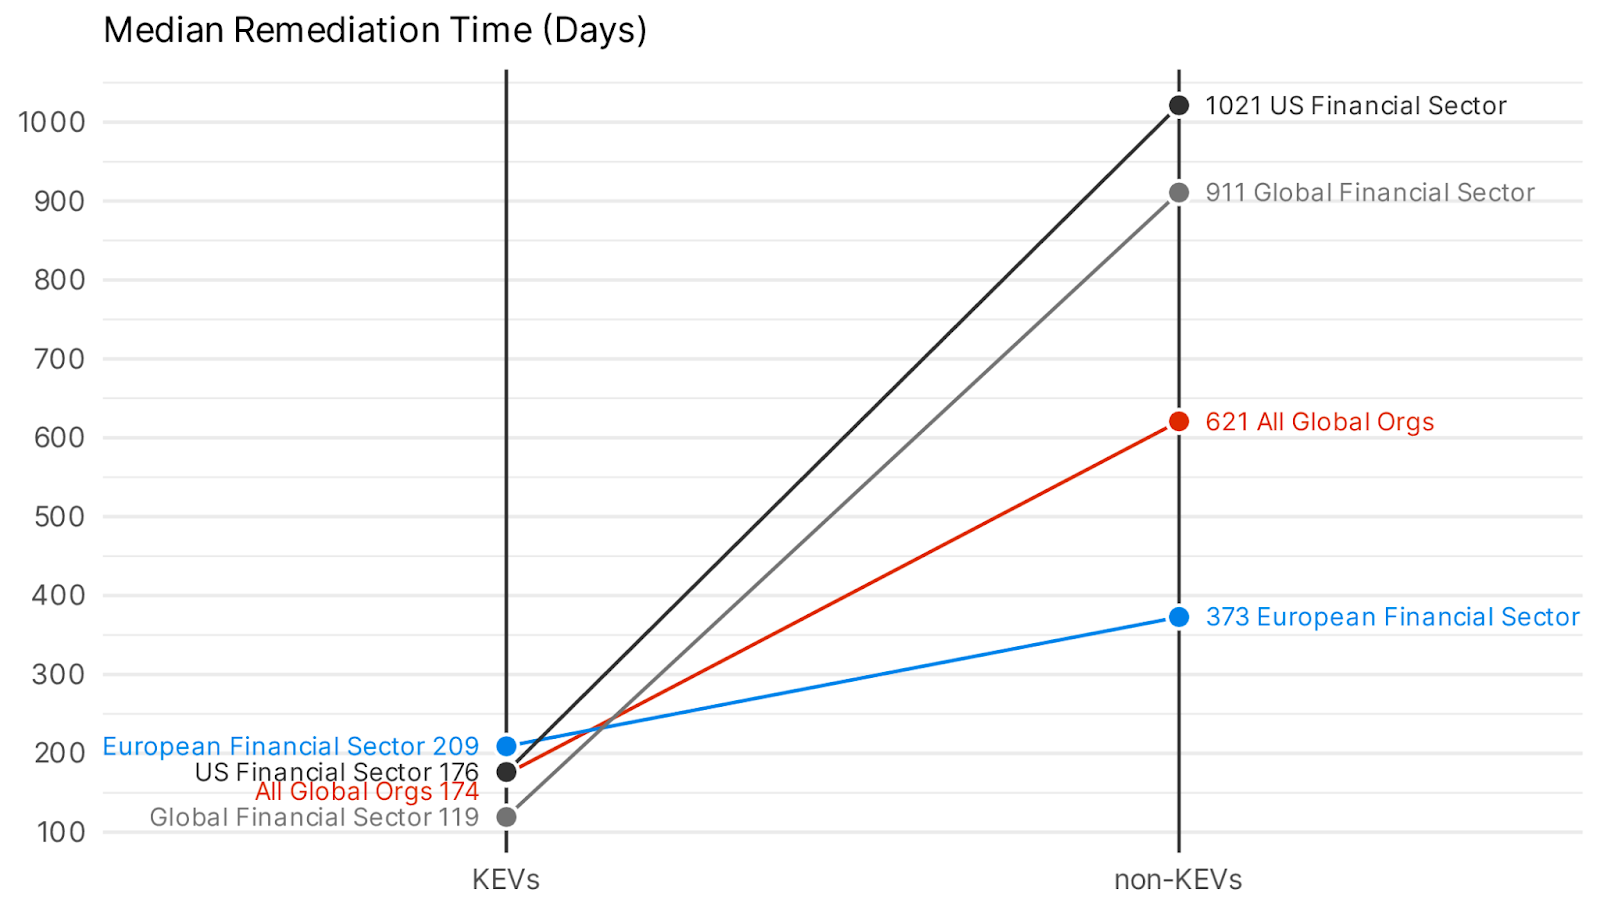
Don’t let the scales in Figure 6 fool you. There is substantial difference between the remediation times in, on only among the non-KEV vulnerabilities on the right, but also among the absolute time on the left. Globally, Finance fixes KEVs in a mere 4 months, 55 days faster than is typical around the globe. But the US financial sector is typically about the same (2 days slower, while Europe is a full month slower). Looking at non-KEVs the ordering nearly reverses. Non-KEVs are fixed more slowly than KEVs, but not nearly as dramatically slower than other geographies. In particular, US financial orgs seem to let non-KEVs linger.
OK, but are any particular sub sectors driving that (relatively) average US financial Sector response? Figure 7 does seem to indicate that it’s driven largely by Banking, Financial Services and Investment Banking.
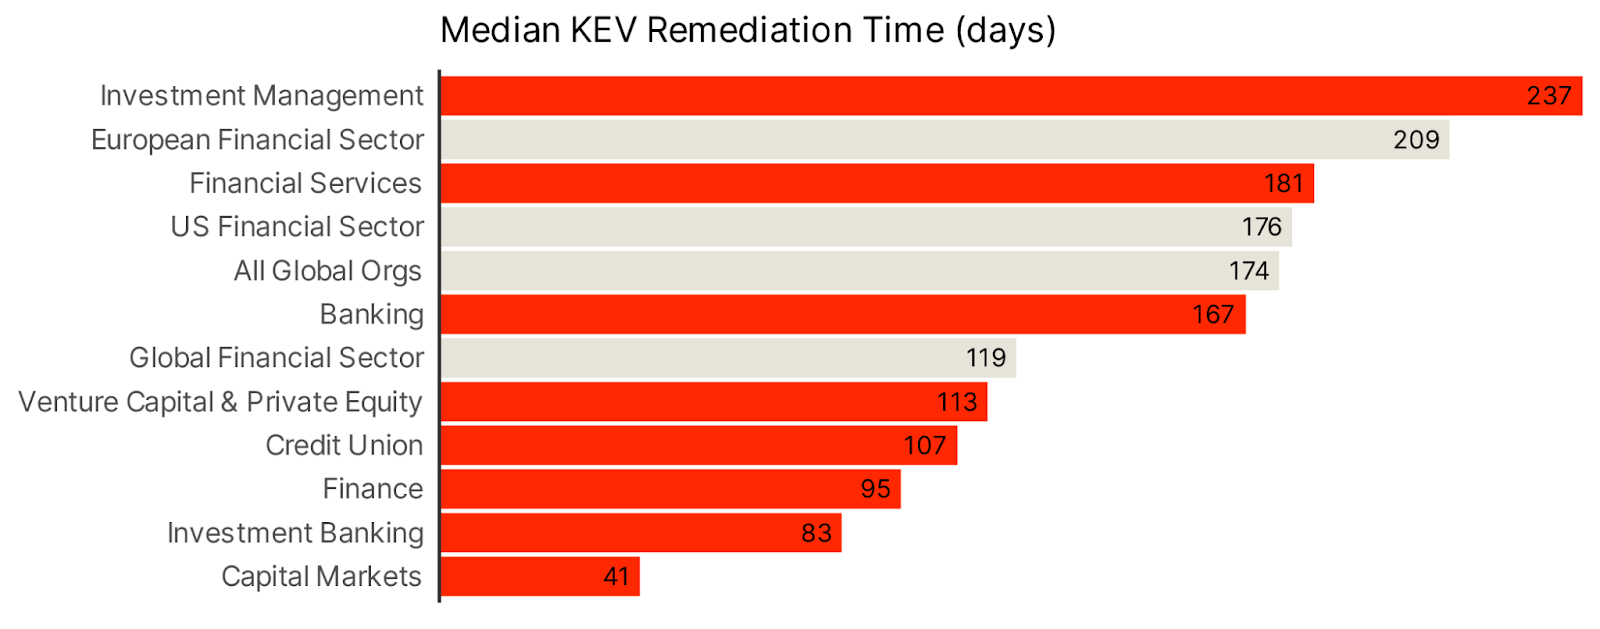
Another interesting tidbit here is Capital Markets absolutely blowing away the competition, fixing 50% of KEVs in a mere 45 days, compared to a global average of 174, nearly 4 times faster. What’s slowing the financial sector down seems to be Banking, Financial Services, and Investment Management.
We can view the interplay between exposure and remediation time below in Figure 8.
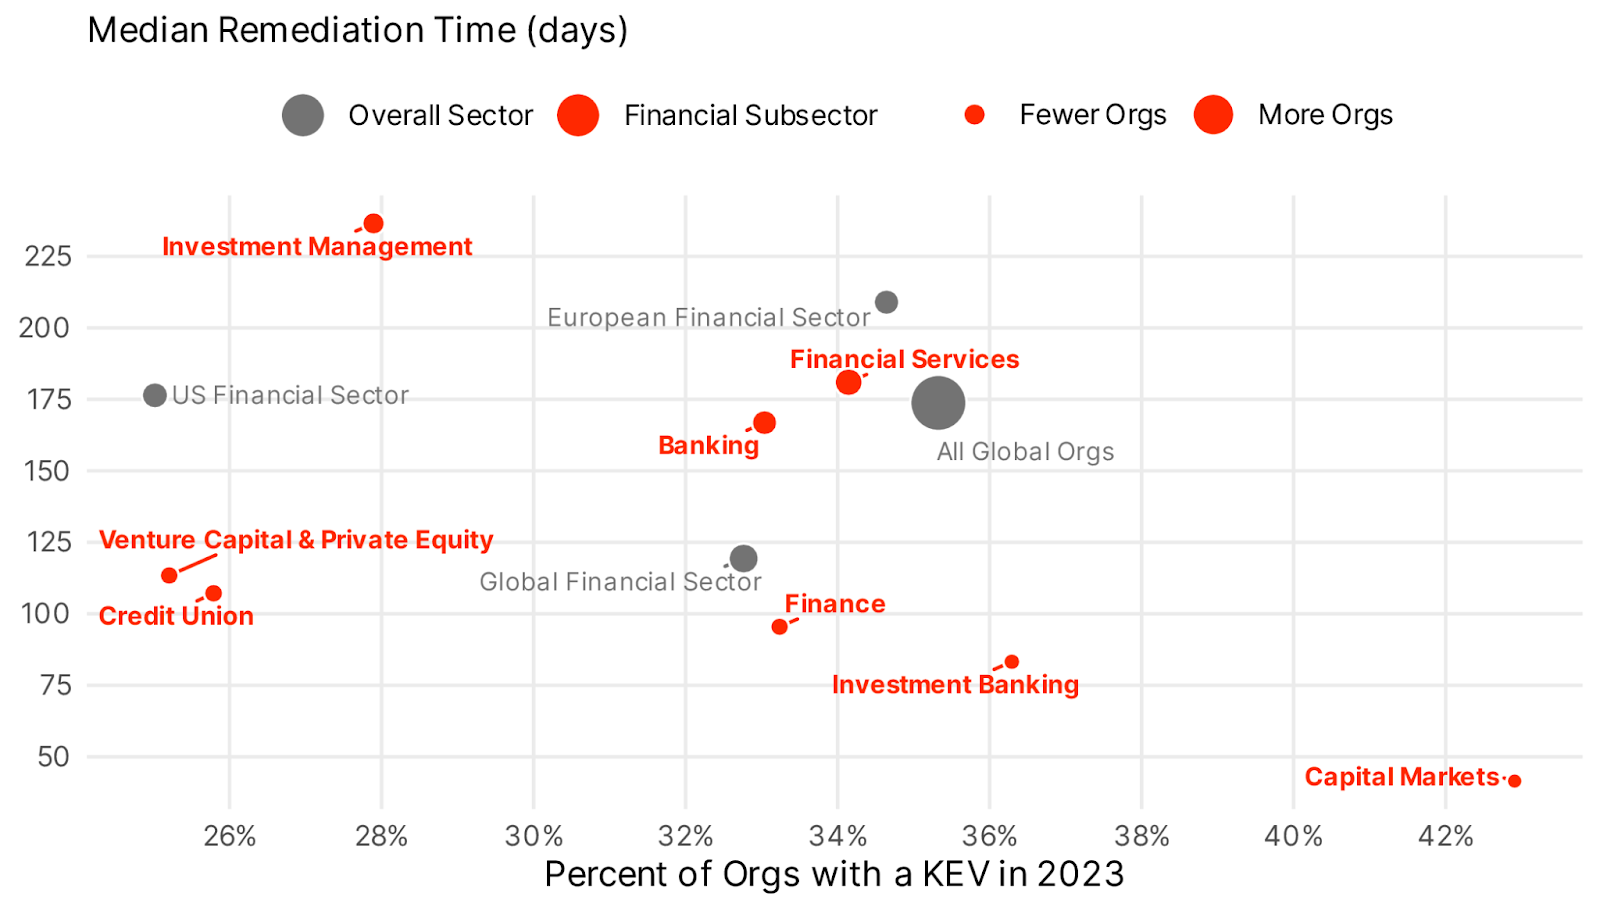
Those fast industries seem to be spread largely across the exposure market. The few Capital Markets organizations are incredibly quick and fixing things but also have the highest exposure. Lastly, we want to do a comparison of KEV remediation time across these different subsectors in broad geographic regions. Things get a little tricky here as we want to maintain results in which we can be statistically confident in, and where we can make a comparison across all three regions. The result is Figure 9 below.
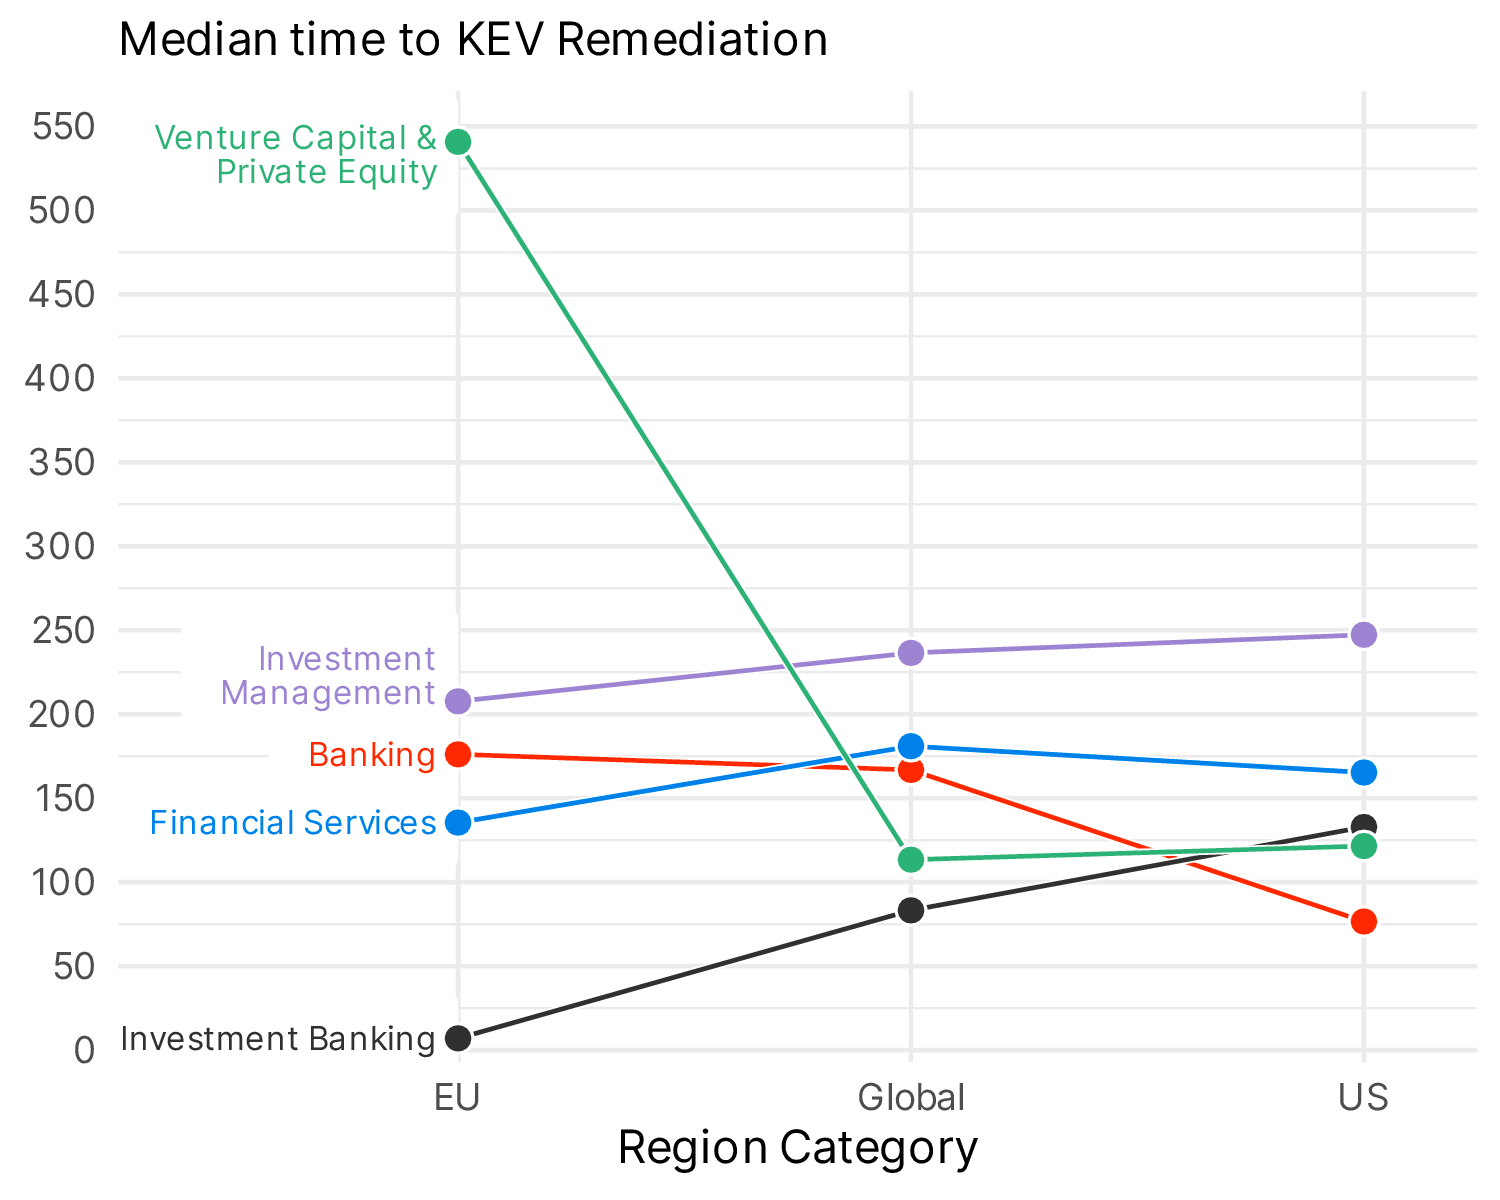
What’s interesting in Figure 9 is where Venture Capital was a relative top performer globally, EU firms seem to struggle. Similarly banking is globally middling but US banks seem to do fairly well overall.
Parting Thoughts
Every one believes their industry to be uniquely positioned within the cybersecurity zeitgeist. The brief analysis above seems to bear that out to some degree. As we start to look at finer, and finer grained slices of particular industries or geographic regions, we’ll see that the orgs within that particular chunk are going to have different performance and potentially outcomes. The financial sector is a great example: overall these organizations perform better than the global average, but if we dig deeper we find pockets of better and worse performance.
Methodology
Many of the example organizations operate in multiple subsectors. Bitsight endeavors to map individual portions of larger entities into their appropriate industry. Our definitions are loosely based on LinkedIn’s industry classification which itself is based on the North American Industry Classification System. But to that end it’s important to understand exactly what these sectors mean and give some examples.
One caveat is that many financial institutions fit multiple industries by the below definitions. We map individual subsidiaries to their parent company frequently and so can separate out divisions that do Investment Banking vs Financial Services for example. The definitions below reflect this with some example organizations.
- Capital Markets This industry includes entities that:
- Underwrite securities issues and/or make markets for securities and commodities;
- Act as brokers between buyers and sellers of securities and commodities;
- Provide securities and commodity exchange services; and
- Manage portfolios of assets, provide investment advice, and provide and trust, fiduciary, and custody services.
- Examples: S&P Global Ratings, SMBC
- Investment Banking This industry includes entities that underwrite, originate, and/or maintain markets for issues of securities, and entities that act as principals in buying or selling securities on a spread basis, such as securities dealers or stock option dealers. Examples: Goldman Sachs, Morgan Stanley, JP Morgan
- Financial Services This industry includes entities that make financial transactions (creation, liquidation, or change in ownership of financial assets) and/or that facilitate financial transactions. Examples: Transamerica, China Construction Bank, Allianz
- Banking This industry includes entities that accept demand and other deposits and make commercial, industrial, and consumer loans. Commercial banks and branches of foreign banks are included. Examples Wells Fargo, Bank of America
- Investment Management This industry includes entities that act as principals or brokers in buying or selling financial contracts (except investment bankers and securities and commodity contracts dealers and brokerages, which are in separate industries). Also included are investment services (except securities and commodity exchanges, which are in separate industries) such as portfolio management, investment advice, and trust, fiduciary, and custody services. Examples: Fidelity, Charles Schwab, TIAA
- Venture Capital and Private Equity This industry includes entities that act as principals (except investment bankers, securities dealers, and commodity contracts dealers, which are in separate industries) in buying or selling financial contracts generally on a spread basis. Examples: Blackrock, All those folks on Sandhill road
As with the original KEV research, we are only examining externally facing KEVs, and specifically those that we can detect without doing damage to a particular Internet facing asset. This represents about 20% of the overall KEV catalog.
1 Or I don’t stop myself and I gotta cut stuff from those big reports.


